

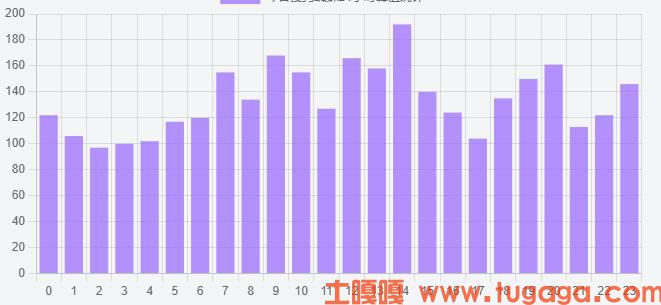
以下代码是将4个文本里的值读出来 按照时间划分没小时的柱形图
<!DOCTYPE html>
<html>
<head>
<title>Hourly Data Bar Chart</title>
<script src="https://cdn.jsdelivr.net/npm/chart.js"></script>
</head>
<body>
<style>
.zhuzi {
width: 600px;
}
.xzz {margin:0px;float:left;margin-left:30px;}
</style>
<div class="zhuzi">
<canvas class="xzz" id="chart1"></canvas>
<canvas class="xzz" id="chart2"></canvas>
<canvas class="xzz" id="chart3"></canvas>
<canvas class="xzz" id="chart4"></canvas>
</div>
<script>
var ctx1 = document.getElementById('chart1').getContext('2d');
var ctx2 = document.getElementById('chart2').getContext('2d');
var ctx3 = document.getElementById('chart3').getContext('2d');
var ctx4 = document.getElementById('chart4').getContext('2d');
// 读取文本文件内容和数据统计函数
function readAndCountData(file, ctx, color, label) {
fetch(file)
.then(response => response.text())
.then(data => {
// 解析文件内容并统计每个小时的数据行数
var lines = data.trim().split('\n');
var counts = Array(24).fill(0);
lines.forEach(line => {
var time = line.split('|')[0].split(':')[0];
var hour = parseInt(time);
counts[hour]++;
});
// 生成24小时标签
var labels = [];
for (var i = 0; i < 24; i++) {
labels.push(i.toString());
}
new Chart(ctx, {
type: 'bar',
data: {
labels: labels,
datasets: [{
label: label,
data: counts,
backgroundColor: color
}]
},
options: {
responsive: true,
scales: {
y: {
beginAtZero: true,
stepSize: 1
}
}
}
});
// 自定义图表容器的高度和宽度
ctx.canvas.parentNode.style.width = '100%';
ctx.canvas.parentNode.style.height = '300px';
});
}
// 调用函数读取和统计文本文件数据
readAndCountData('AAAfanAAA/config/zhizhulog/baidu/20230825.txt', ctx1, 'rgba(0, 123, 255, 0.5)', '今日百度蜘蛛');
readAndCountData('AAAfanAAA/config/zhizhulog/360/20230825.txt', ctx2, 'rgba(255, 0, 0, 0.5)', '今日360蜘蛛');
readAndCountData('AAAfanAAA/config/zhizhulog/sougou/20230825.txt', ctx3, 'rgba(0, 123, 255, 0.5)', '今日搜狗蜘蛛');
readAndCountData('AAAfanAAA/config/zhizhulog/shenma/20230825.txt', ctx4, 'rgba(255, 0, 0, 0.5)', '今日神马蜘蛛');
</script>
</body>
</html>